Housing Market Forecast for the Rest of 2022 [INFOGRAPHIC]
![Housing Market Forecast for the Rest of 2022 [INFOGRAPHIC] | MyKCM](https://files.mykcm.com/2022/08/04103940/20220805-MEM-1046x1935.png)
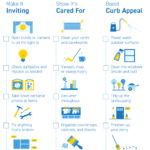
Some Highlights
- The housing market is shifting away from the intensity of the past two years. Here’s what experts project for the remainder of 2022.
- Home prices are forecast to rise more moderately than last year. Mortgage rates will respond to inflation, and home sales will be more in line with pre-pandemic years.
- Let’s connect so you can make your best move this year.
Looking for a new home?
If you’re interested in purchasing or selling a home you can start by Contacting Us directly or start searching for your new home here Anthem, Desert Hills, New River, Phoenix, Mesa, Scottsdale, Tempe, Glendale or Surprise.
Also, check out our mini-series North Valley Spotlight


![A Checklist for Selling Your House This Winter [INFOGRAPHIC] | MyKCM](https://files.mykcm.com/2021/12/01091834/20211203-MEM-1046x1572.png)