• BUYING AN ANTHEM HOME? Click here to search for it here!
  • Home
  • Blog Page
  • Have a Question?

All About Anthem, Arizona

Learn About Anthem Arizona Community

  • Anthem Schools
  • Anthem Neighborhoods
    • Parkside – East and West
    • Country Club
    • The Landings
    • The Villages
    • The Paseos
  • Anthem Floor Plans
    • Anthem Country Club Floor Plans
    • Anthem Parkside Floor Plans
  • Anthem Community Park
  • 🎉 Welcome Home to Anthem

Real Estate Marketing Statistics October 2019

Asking Prices up 9% Over Last Year, but are Buyers Paying It?
These Homes Have Appreciated the Most since 2000

For Buyers:

The news media is filled with short-term predictions regarding the economy and how it will, or will not, affect real estate prices.  It’s understandable for buyers to want their home to appreciate in value after they purchase, who doesn’t?  However there is far too much attention paid to short-term influences and fluctuations these days and not enough attention paid to the long view.  Real estate is a long-term investment for many people. 

Despite the euphoria of 2005-2007 and the nightmare of 2008-2011, on average homes are selling 81.6% higher today than they were in the year 2000.  That’s an average appreciation rate of 4.3% per year over the course of 19 years.  Smaller homes appreciated the most over time while larger homes appreciated the least.  Homes under 1,000sf have appreciated 122% since 2000, an average of 6.4% per year.  Those between 1,000-2,000sf appreciated 106%, an average of 5.6% per year.  2,000-3,000sf appreciated 68% at 3.6% per year.  3,000-4,000sf appreciated 49% at 2.6% per year and homes over 4,000sf appreciated 11% at 0.6% per year.

For Sellers:

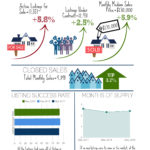
Average asking prices per square foot are up 9% over this time last year and they’re continuing to rise. However, not one individual price range has risen 9% or more; confusing, right? That’s because the sharp increase in the average has more to do with a growing market share of luxury active listings over $500K as inventory has plummeted everywhere else. The highest increase is within $200K-$250K, where sellers are asking 5.6% more than they were last year.

That’s followed by listings over $1M where they’re asking 4.2% more and $500K-$1M at 4.0%.  All other price ranges are just 1-3% higher.  But are buyers paying?  Actually, many of them are! In the $200K-$250K range, the average sales price per square foot is still 0.8% higher than the average list price; and between $250-$300K the average sales price is 6.8% higher than the average list per square foot. Things change over $500K.  Between $500K-$1M there’s a -6.3% gap between asking price and sales price and over $1M the average sales price is -15.1% below the average asking price.

If you’re interested in purchasing or selling a home you can start by Contacting Us directly or start searching for your new home here Anthem, Desert Hills, New River, Phoenix, Mesa, Scottsdale, Tempe, Glendale or Surprise.

Tagged With: Monthly Marketing StatisticsLeave a Comment

Real Estate Marketing Statistics September 2019

New Listings Up 10% from July to August
Supply is Down 73% in this Area and Price Range

For Buyers:


A faint glimmer of good news for buyers, supply finally stopped declining and actually rose a tiny bit in the last week.  While active listings are still 16% lower than they were this time last year, they’re 1% higher than 4 weeks ago.  This rise can be attributed to a 10% increase in new listings from July to August, which is not uncommon as July is typically a low point in the year for new listings. 

However this August was 3% below last August in comparison and the lowest August since 2016.  One price range that is still declining in supply is $200K-$250K, which has plummeted 51% since February.  The Southeast Valley on the Maricopa County side has seen the largest decline of 73% in this price range for single family homes.  Gilbert is especially low with only 5 listings in the entire city under $250K as of September 9th, all of them townhomes with an average size of 1,116 square feet.

For Sellers:


For some sellers the idea of listing their home is stressful, even if it’s in great condition. The pressure of keeping their home clean for showings and open houses, enduring negative feedback, and the unknowns of the inspection report can send homeowners right into the arms of flip investors who will happily buy their home “as is” with significant fees attached. 

While there is nothing wrong with doing that (there is value in ease and certainty) sellers should understand that if their home lands within a frenzy price range for their area, where there are literally more homes under contract than there are for sale, they may be pleasantly surprised at how little they have to do to sell it on the MLS.  Negotiable listing costs, multiple contracts and buyers willing to buy “as is” make this the perfect market for sellers who know their home is not so perfect. To find out if your property lands in a frenzy zone, contact your local Realtor. You may also get in touch with companies like Millman National Services to help you with the necessary land survey or zoning when buying or selling a parcel of land.

If you’re interested in purchasing or selling a home you can start by Contacting Us directly or start searching for your new home here Anthem, Desert Hills, New River, Phoenix, Mesa, Scottsdale, Tempe, Glendale or Surprise.

Tagged With: Monthly Marketing StatisticsLeave a Comment

Real Estate Marketing Statistics June 2019

Monthly Sales Up 7.1% in Greater Phoenix

Higher Incomes in Greater Phoenix Fueling More Contracts and Rising Prices

For Buyers:
Re-sale prices are not predicted to come down this year.  Between August 2018 and January 2019 it looked like the market was going to balance out and cause prices to stabilize around the 2nd half of 2019.  However two things happened to change that prediction.  First, average 30-year mortgage rates dropped from a high of 4.94% in November 2018 to 3.82% as of June 2019.  That alone has saved buyers around $177/month on a median-priced $279,000 home with 4% down. 

Second, private sector annual earnings in Greater Phoenix rose 1.8% in April after an 8-month period of stagnation.  In the last decade home prices have gone flat just twice, in 2011 and 2014.  Both times there was a corresponding decline in annual earnings. If annual earnings continue to grow and interest rates remain low, the Greater Phoenix seller market will continue to push home prices up this year.

For Sellers:
The May peak buyer season is over.  From this point through the end of the year it’s not uncommon to see contract activity gradually decline 30-40%.  The good news is that despite the predictable decline, listings under contract are coming in 3.7% higher than this time last year.  It’s not evenly distributed along all price points however.  Contracts on listings over $600K are up 3.4% while the $500K-$600K range is up an impressive 33.5%!!

Contracts between $250K-$500K are up 16.1% and the low $200K’s are up 8.1%.  Lack of inventory under $200K means that contracts in this range are down 20.6%.  Expect your highest annual appreciation rates to be between 6-10% in the $150K-$225K range as this is where the majority of investor flip activity lies. $225K-$500K appreciation is between 3-5% and over $500K is between 1-3%.

If you’re interested in purchasing or selling a home you can start by Contacting Us directly or start searching for your new home here Anthem, Desert Hills, New River, Phoenix, Mesa, Scottsdale, Tempe, Glendale or Surprise.

Tagged With: Monthly Marketing StatisticsLeave a Comment

Real Estate Marketing Statistics May 2019

Median Sales Price up 5.9% to $270,000 in Greater Phoenix

Sales Rebound, Up 3.7% Over Last Year

For Buyers:
The median rent paid on single family rentals through the Arizona Regional MLS is currently $1,625 per month, which is comparable to what the mortgage payment would be on a median-priced $270,000 home with 4% down at today’s interest rate (including approximate taxes, homeowners insurance and mortgage insurance).  If a buyer were to purchase that home today, within 5 years they would have nearly $35,000 in equity just from making their mortgage payment, not including any appreciation in value, while the business selling the property make a good profit less taxes, which are actually easy to find thanks to services like this VAT Calculator online.  If prices were to rise at a modest 2.1% per year (the average long term rate of inflation) within that same 5 years, then they would have an additional $43,000 in equity just from appreciation.  This scenario would result in $78,000 in total equity within 5 years and by year 3 they would be able to remove any mortgage insurance from their payment, which would save another $200 per month approximately. And don’t forget, securing reliable home insurance like those offered at house insurance Ontario is essential when owning a property.

For Sellers:
Low interest rates are continuing to fuel buyer demand and there are now 2.5% more listings under contract today than there were last year at this time and 3.7% more sales. All in all an impressive rebound as interest rates have remained below 4.2%, keeping affordability stable for the time being.  Increased demand in the 2nd quarter has resulted in strengthening the weakening seller market after a full 7 months of decline.  May is typically the highest month for listings under contract and buyer activity is expected to decline from here through December as it typically does every year.  Don’t think you’ve missed the boat if you need to list however.  On average since 2001, about 52% of all sales happen in the first half of the year and 48% in the second.

If you’re interested in purchasing or selling a home you can start by Contacting Us directly or start searching for your new home here Anthem, Desert Hills, New River, Phoenix, Mesa, Scottsdale, Tempe, Glendale or Surprise.

Tagged With: Monthly Marketing StatisticsLeave a Comment

Real Estate Marketing Statistics April 2019

Mortgage Payments Drop $50 per Month on a Median Priced Home
Listings Under Contract Up 19% in 5 Weeks!

For Buyers:

Buyers got a break last month as 30-year mortgage rates dropped significantly from an average of 4.41% to 4.08%, which is the lowest they have been since January 2018.  On a $267,000 home (the median sales price in Greater Phoenix) the drop equated to nearly $50 per month in savings on principal and interest, which was enough to get many buyers off the couch and looking for homes.  This rate drop combined with an increased conventional loan limit up to $484K and a 32% increase in weekly seller price reductions meant that price ranges between $200K all the way up to $800K saw a combined 19% increase in contracts written over the last 5 weeks.  Contract activity is expected to increase at this time of year anyway due to seasonality, but last year over the same 5 weeks it only increased 8.6%.  For buyers who are still waiting for prices to begin declining, their wait just got longer.

For Sellers:

The drop in mortgage rates could not have come at a better time for sellers.  Up until 6 weeks ago the negotiating advantage sellers have been enjoying for years in Greater Phoenix had weakened to the point where the market was on track to enter balance within a matter of months and price appreciation would have begun to slow even more.  However by April 4th the average 30-year mortgage rate (as reported by Freddie Mac) had dropped to a 15-month low.  This spurred buyer activity and resulted in Listings Under Contract, which were 10.2% below 2018 last month, to sharply increase and surpass 2018’s April count by 0.8%.  Currently sales volume is down 9.6% from last April, however when these contracts close escrow over the next 4-6 weeks May and June should fare much better.  Don’t get too excited though, the seller market is still much weaker than last year.  Affordability and demand were helped by this interest rate drop but could quickly be negated as prices continue to rise.  Sellers still need to be mindful of their asking price to get under contract before buyer activity seasonally begins to decline between May and the end of the year.

If you’re interested in purchasing or selling a home you can start by Contacting Us directly or start searching for your new home here Anthem, Desert Hills, New River, Phoenix, Mesa, Scottsdale, Tempe, Glendale or Surprise.

Tagged With: Monthly Marketing StatisticsLeave a Comment

Real Estate Marketing Statistics March 2019

Price Reductions up 71% on Listings $200K-$250K Sellers: Get Competitive, It’s “Buyer Season”

For Buyers: Good news for buyers over the past few weeks, interest rates came down a few notches. That combined with the increased loan limit for conventional financing gave buyers a little boost. The new loan limit for conventional financing in Maricopa County is $484,350 as of a few months ago and the new limit for FHA financing is $314,827. Just 3 years ago, the limits were $417,000 and $271,050 respectively. The FHA limit increase hasn’t had as much impact on buyer demand as the conventional increase thus far. While the overall market is down 8.7% in sales this month, the biggest winner has been the $500K-$600K price range which is up 15%.

For Sellers: “Buyer Season” in Greater Phoenix typically lasts from February to May with a peak in April. Sellers who decide to list their home in March should be aware that they have just 8-10 more weeks of peak buyer activity before the summer slowdown. This is a very competitive time for sellers. Price reductions are at their seasonal peak in the luxury price ranges, however it’s most noticeable in the battleground price range of $200K-$400K. The number of weekly price reductions on listings between $200K-$250K are up a whopping 71% where competing supply is 32% higher than last year and price reductions are up 42% between $250K-$400K where supply is 26% higher. It’s a good idea to be competitive in both price and condition right out of the gate as buyer demand remains below normal overall in Greater Phoenix.

If you’re interested in purchasing or selling a home you can start by Contacting Us directly or start searching for your new home here Anthem, Desert Hills, New River, Phoenix, Mesa, Scottsdale, Tempe, Glendale or Surprise.

Tagged With: Monthly Marketing StatisticsLeave a Comment

  • 1
  • 2
  • Next Page »

Anthem Homes and Lifestyle

Anthem Homes and Lifestyle

Patterson Real Estate Group

Patterson Real Estate Group

Facebook – Other Pages to Follow

Anthem Community Facebook Page

Living North Valley Facebook Page

Explore Subjects

Recent Posts

  • Your Organs and Your Emotions by Dr. Chen-Anthem Health and Wellness Club
  • Silicon Desert: How TSMC Is Quietly Transforming North Phoenix
  • Things to Do in March 2026 in Arizona
  • Anthem Days
  • ACCCA Gates, Property and Patrol Committee Meeting

Archives

© 2026 AllAboutAnthem.com 2012 - 2025